One json.dumps Took Our Context Compression From 0% to 86%
Every LLM call in our fleet funnels through one chokepoint. That makes it the obvious place to put context compression: shrink the payload once, on the way out, and every agent in the system gets cheaper without a single caller changing.
So we put a compression sidecar there, switched it on, and measured it. It worked beautifully on tool output — about half of every structured result was redundancy the model never needed. And on the two payload types that actually dominate our context windows, retrieved documents and file contents, it saved exactly nothing.
Not a little. Zero. Bytes in, same bytes out.
The flag that wasn't the problem
The obvious suspects were all wrong. The compressor was enabled. The sidecar was healthy and reachable. It returned success. It just declined to compress the thing we most wanted compressed.
The vendor documentation had an answer: present bulky context as tool_result
blocks. We tried it. Zero. We tried the compress_user_messages flag. Zero. We
tried a different message role. Zero.
At that point the useful move is to stop reading documentation and start varying one thing at a time. We took a single payload — 120 retrieved documents — and pushed it through the compressor five ways, changing only how it was packaged:
| Same content, sent as | Tokens | Saved |
|---|---|---|
| Plain prose, tool role | 4,696 → 4,696 | 0.0% |
| JSON-serialized | 4,821 → 645 | 86.6% |
tool_result content blocks | 4,955 → 4,955 | 0.0% |
compress_user_messages: true | 4,696 → 4,696 | 0.0% |
| Assistant role | 4,696 → 4,696 | 0.0% |
There it is. Not the role. Not the block type. Not the flag. Structure.
The compressor's crusher works on structured data — it finds repeated keys, redundant shapes, fields that restate each other. Flat prose gives it nothing to grip. Wrap the identical content in JSON and it goes from saving nothing to saving 86.6%.
It holds across payload types:
| Bulky context | As raw text | As JSON |
|---|---|---|
| Retrieved documents | 0.0% | 86.6% |
| File contents | 0.0% | 75.3% |
| Structured records | — | 49.2% |
The practical version: wherever you stuff bulk into a message, serialize it —
{"docs": [...]}, {"path": "contents"} — instead of joining it into a wall of
text. It costs one json.dumps, and it roughly doubles what compression can
reach.
This is easy to get wrong in the obvious direction. Concatenating your retrieved chunks into one readable string is the natural way to write it, reads better in a debugger, and saves you nothing.
The number we didn't ship
Applying that to a repetitive code dump produced a 98.3% reduction. 7,219 tokens down to 121.
A number that good is a smell. Compression that aggressive isn't compression; it's deletion with a nicer name.
So we ran a canary. Bury one unique, unmistakable line inside a large payload, compress it, and check whether it survives the round trip.
| Content | Ratio | Unique fact survived? |
|---|---|---|
| Diverse JSON records | 49.2% | Yes — intact |
| Repetitive code dump | 97.1% | No — definition dropped |
The compressed code shows the mechanism plainly. It keeps the first couple of
entries, then samples: handler_0, handler_1, handler_22, handler_44,
handler_66, handler_88. Structurally similar lines get treated as redundant
and thinned out — which is correct behavior for genuinely repetitive data, and
catastrophic for code.
Our canary function came out mangled: its comment survived, its def line did
not. The output wasn't a shorter version of the input. It was code describing a
function that no longer existed.
So the rule we actually operate on: around 50% on diverse structured data is the number to plan against. Unique values survive there — we checked. Anything above 90% means your input was mostly repetition and the crusher sampled it. Never point that at code, or at any payload where individual rows carry meaning, without a canary first.
The bigger lever is not compressing at all
Compression is a finishing pass. While measuring it we also measured the two layers above it, and they dwarf it.
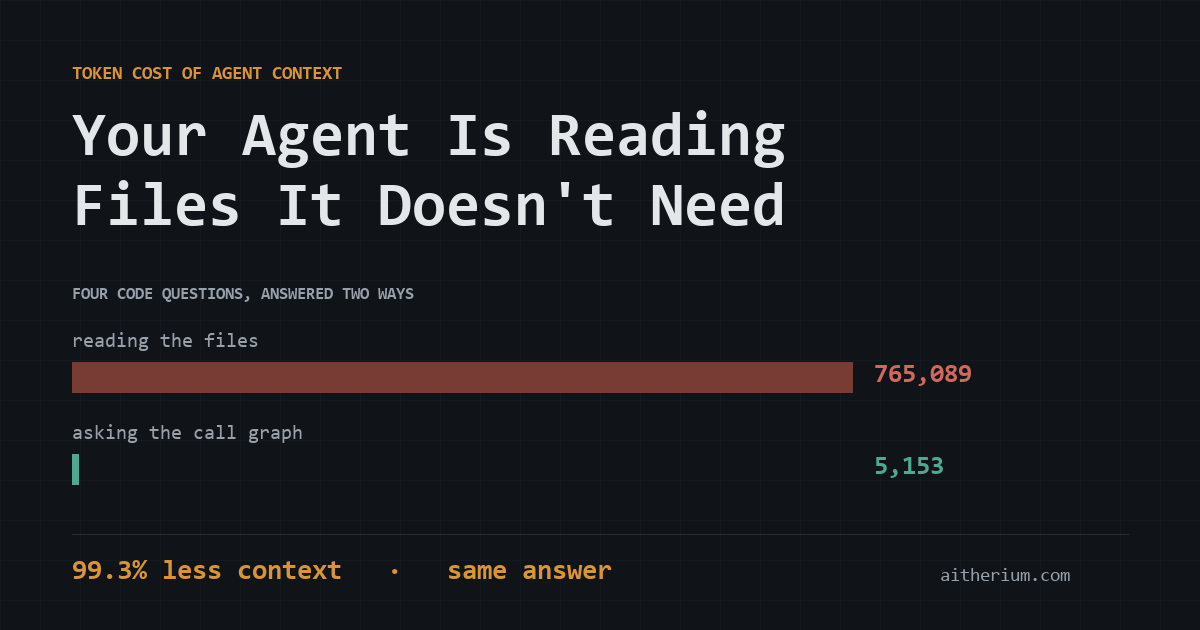
Ask the index, don't read the files. We keep a call-graph index of the codebase — every function and class as a chunk, with signatures, callers and callees. Asking it a question returns symbols and edges instead of file bodies. Against the unassisted loop, where an agent greps and then reads every file the hits live in:
| Query | Indexed answer | Reading the files | Saved |
|---|---|---|---|
| authentication | 1,010 | 57,652 | 98.2% |
| llm gateway | 1,346 | 26,572 | 94.9% |
| compression | 1,460 | 158,762 | 99.1% |
| rate limit | 1,337 | 522,103 | 99.7% |
| Total | 5,153 | 765,089 | 99.3% |
Note the spread — it's the interesting part. "llm gateway" only saved 94.9% because the answer genuinely lives in two files. "rate limit" saved 99.7% because the term is scattered across half a megabyte of source that has nothing to do with the answer. The worse the grep, the more the index saves. And greps get worse as codebases get bigger.
Narrow the tree before you search it. Above the index sits a semantic map: directories clustered into landmarks, each tagged by purpose — auth, api, data, config, tooling. Building it over our library tree takes about ten seconds and produces 149 landmarks. After that, locating anything is a cache hit:
| Question | Directories | Tokens | Time |
|---|---|---|---|
| where is authentication enforced? | 3 | 187 | 7 ms |
| where is the llm gateway? | 3 | 143 | 6 ms |
| where are compression tools? | 3 | 177 | 6 ms |
| where is memory stored? | 3 | 185 | 5 ms |
The tree those run against is 2,803 files — roughly 11.7 million tokens. About 180 tokens and six milliseconds buys you the three directories worth opening. Then the index only has to work inside them.
What it adds up to
| Layer | Question it answers | Saving |
|---|---|---|
| Navigation | Which directories matter? | ~180 tokens vs the tree |
| Code search | Which symbols, and who calls them? | 94–99% |
| Compression | How big is what's left? | ~50%, up to 86% serialized |
They compose, but they are not equals. Navigation and code search stop the agent reading things at all — that's the structural win. Compression shrinks whatever genuinely has to be sent, and it's the only one of the three that asks nothing of the caller: it runs at the gateway, on every call, invisibly.
Which is exactly why the serialization finding mattered so much to us. The layer that requires no cooperation was the layer quietly doing nothing, on the payloads that cost the most, because of how we happened to assemble a string.
The pattern underneath all three is the same move at different altitudes: answer a narrower question first. Which directories, before which files. Which symbols, before which bytes. What's redundant, before what's sent.
Most of what fills an agent's context window isn't information. It's bulk — files it didn't need, rows that repeat, prose that restates. Once you start measuring which is which, the context problem mostly stops being one.
All figures measured live against the running fleet: code search and navigation against a 2,803-file, 128,923-chunk index; compression against the production sidecar using the tokenizer's own token counts. Naive file-read costs estimated at 4 characters per token.